Configuration#
Beam Corset’s plotting functions offer quite a few customization options. In most scenarios, the default settings should be sufficient. However, if you want to overwrite them for one call, you will most likely want to adjust them for all calls. This can be facilitated using the Config class and its inner classes that hold global configuration options as class variables.
For example, for optical setup plots and related plots, we can specify whether we want to show a legend or not.
[1]:
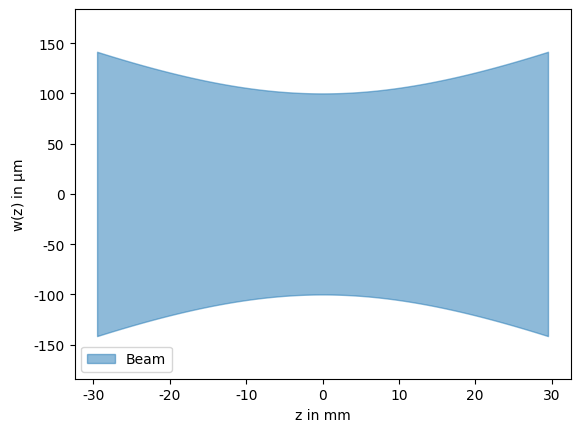
from corset import Beam

beam = Beam.from_gauss(0, 100e-6, 1064e-9)
beam.plot(show_legend=True); # show the legend

If no value is passed, as we would typically do in most situations, the value for show_legend is taken from the global configuration value Config.PlotSetup.show_legend. Using the config, we can set this value without having to specify it at each call. This also means we can specify it in cases where we can not explicitly pass arguments like the implicit plotting done for PNG representations in Jupyter notebooks.
[2]:
from corset import Config

Config.PlotSetup.show_legend = True
beam # implicit Beam.plot() call uses config values
[2]:
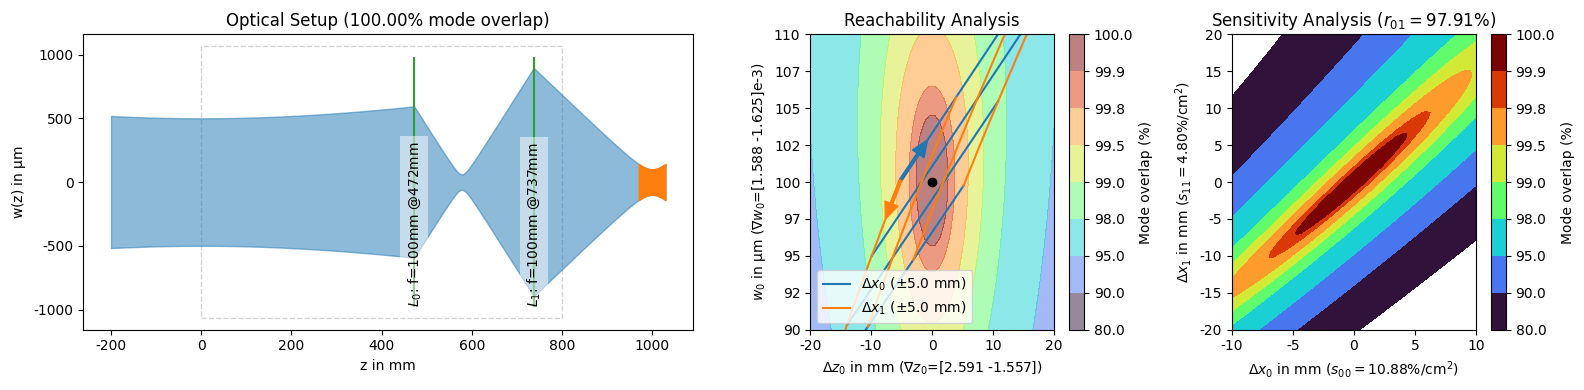
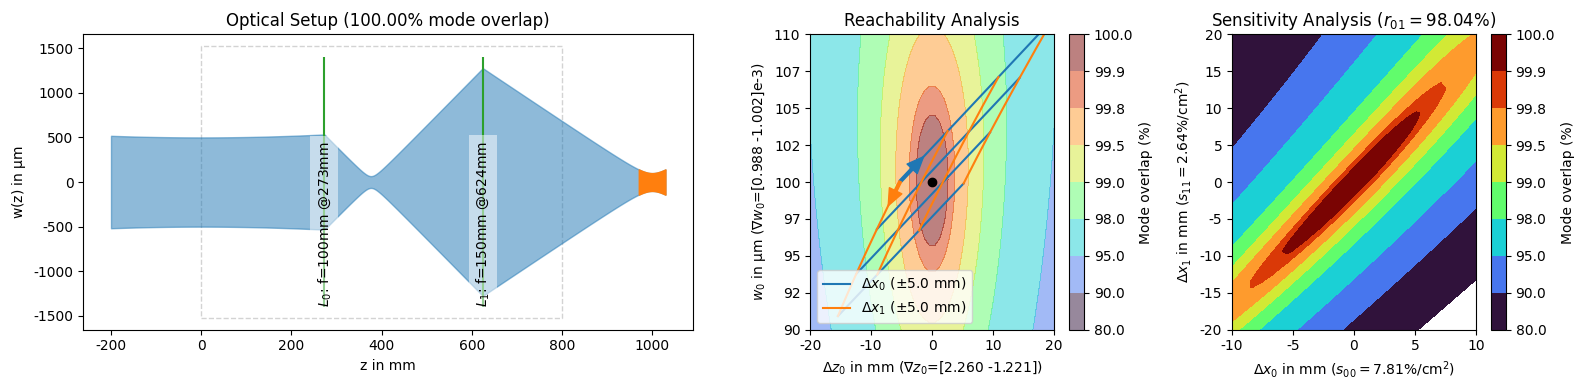
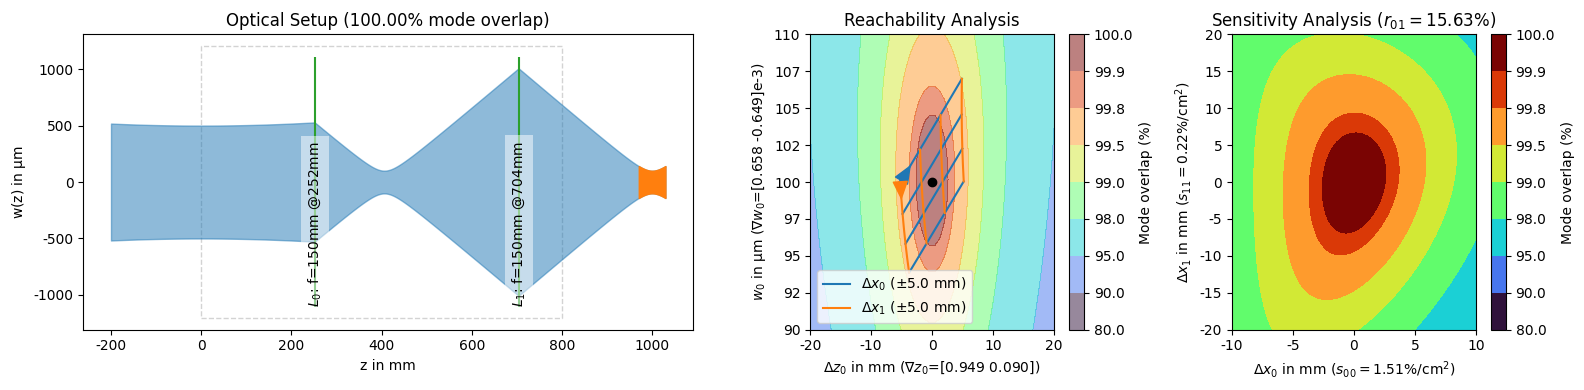
One common use case where this is also very practical is to explicitly set the ranges of the reachability and sensitivity plots so they share the same scale across all solutions. In this case we do not specify the ranges in the Config.PlotReachability and Config.PlotSensitivity inner classes, because they interpret no values as using automatic range instead of resorting to configuration values. Instead, we set the Config.PlotAll.reachability_kwargs and Config.PlotAll.sensitivity_kwargs dictionaries which ModeMatchingSolution.plot_all() uses to pass arguments to the respective plotting functions.
[3]:
from corset import ThinLens, ShiftingRange, mode_match
from IPython.display import display

solutions = mode_match(Beam.from_gauss(0.0, 500e-6, 1064e-9), Beam.from_gauss(1.0, 100e-6, 1064e-9), [ShiftingRange(0.0, 0.8)], [ThinLens(f) for f in [100e-3, 150e-3]], 2, 2)

# fix ranges so they are the same for all plots
Config.PlotAll.reachability_kwargs = {"focus_range": (-20e-3, 20e-3), "waist_range": (90e-6, 110e-6)}
Config.PlotAll.sensitivity_kwargs = {"x_displacement": 10e-3, "y_displacement": 20e-3}
display(*solutions)
See corset.config for all available configuration options.